NASA Reveals Rebound in NO2 Density in China, PM2.5 Returns Too
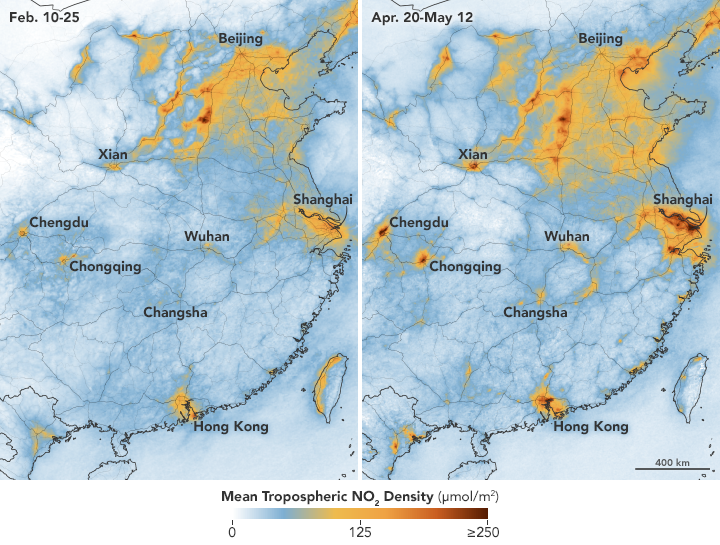
NASA has released new maps to present their data on the nitrogen dioxide (NO2) density in China, revealing an undeniable rebound in levels commensurate with the country's economy reopening.
Earlier this year, we criticized an academic blog that made waves when they used NASA images and other data sets from February and January 2020 to show that the COVID-19 lockdown had resulted in reduced pollution in China. However, they failed to account for year-over-year comparisons, and missed the fact that historically, the country sees an annual reduction in pollution around the time of the Lunar New Year.

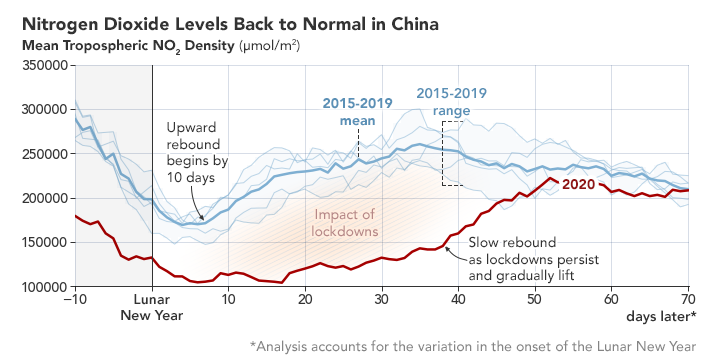
The recent blog by NASA’s Earth Observatory on the other hand does compare year-over-year findings, showing that NO2 levels stayed well below the 2015-2019 range for more than 40 days after the New Year celebrations. It also shows that by 50 days after the New Year, levels had already returned to near-average for the five-year period.
Curiously, however, their data also shows that NO2 density at the beginning of 2020 had already been significantly lower than any of the previous five years, clocking in just three-fifths as much of the gas per square meter compared to the 2015-2019 average.

In previous years, density levels had dipped leading up to the New Year holiday and revived within 20 days. On the other hand, 2020 saw a delayed rebound, but the return to average levels after having reduced pollution prior to the lockdown throws a wrench into the suggestion that COVID-19 has been good for the environment.
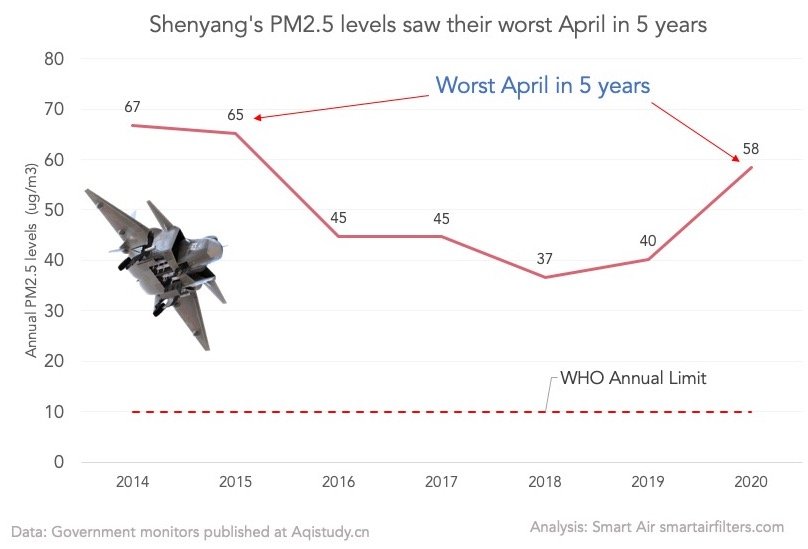
“It's difficult to pinpoint the exact reasons for the rebound in air pollution,” says Paddy Robertson, CEO of Smart Air, which has recently analyzed the reduction and rebound of pollution in China. “But data suggests multiple types of pollutants – NO2 and PM2.5 – have rebounded to the levels we saw four to five years ago. In Shenyang, the city where we saw the worst rebound in PM2.5, pollution levels in April 2020 were the worst for that month in five years.”

As Robertson and his team continue to look into the implications of COVID-19 on the environment, he says that one question is particularly interesting – where is the NO2 coming from? Typically, the gas comes from the transportation sector, but at present, more data analysis is needed in order to pinpoint the source of the rebound.
It is worth noting, however, that not everywhere in China has seen an increase in NO2 since COVID-19 measures have been relaxed (see the image at top), and Beijingers will be glad to know that the NASA data actually shows a reduction in NO2 in parts of the capital between February and May.
As for what is to come, it is not entirely clear what China will do about the national rebound. While the country has temporarily released itself from GDP growth goals, it has also neglected to set specific goals for pollution reduction after the previous “Air Pollution Action Plan,” which resulted in significant pollution cut-backs, expired last year.
READ: Beicology: A Sign of Recovery for Migratory Birds, Naughty Corporations Shamed
Images: NASA Earth Observatory, Smart Air


